Our failed payments dropped from 14-19% on monthly subscriptions to 3.5%. Analytics and reporting help us track exactly what is working.
Analytics See where revenue comes from, where checkout leaks, and what to improve.
Spiffy reports connect product sales, checkout performance, customer value, failed payments, and filtered exports to the system taking the payments.
Try Spiffy risk‑free for 30 days.
Analytics overview
Turn data into clearer growth decisions.
The old analytics page covered a lot because the product does a lot. This version keeps that depth, but groups it around the questions a revenue team actually asks.
Custom reports
Build report views with filters, saved context, and the metrics your team needs.
Revenue analytics
Track revenue growth, order performance, payment success, and offer health.
Customer insights
See lifetime value, customer behavior, subscriber signals, referrals, and churn.
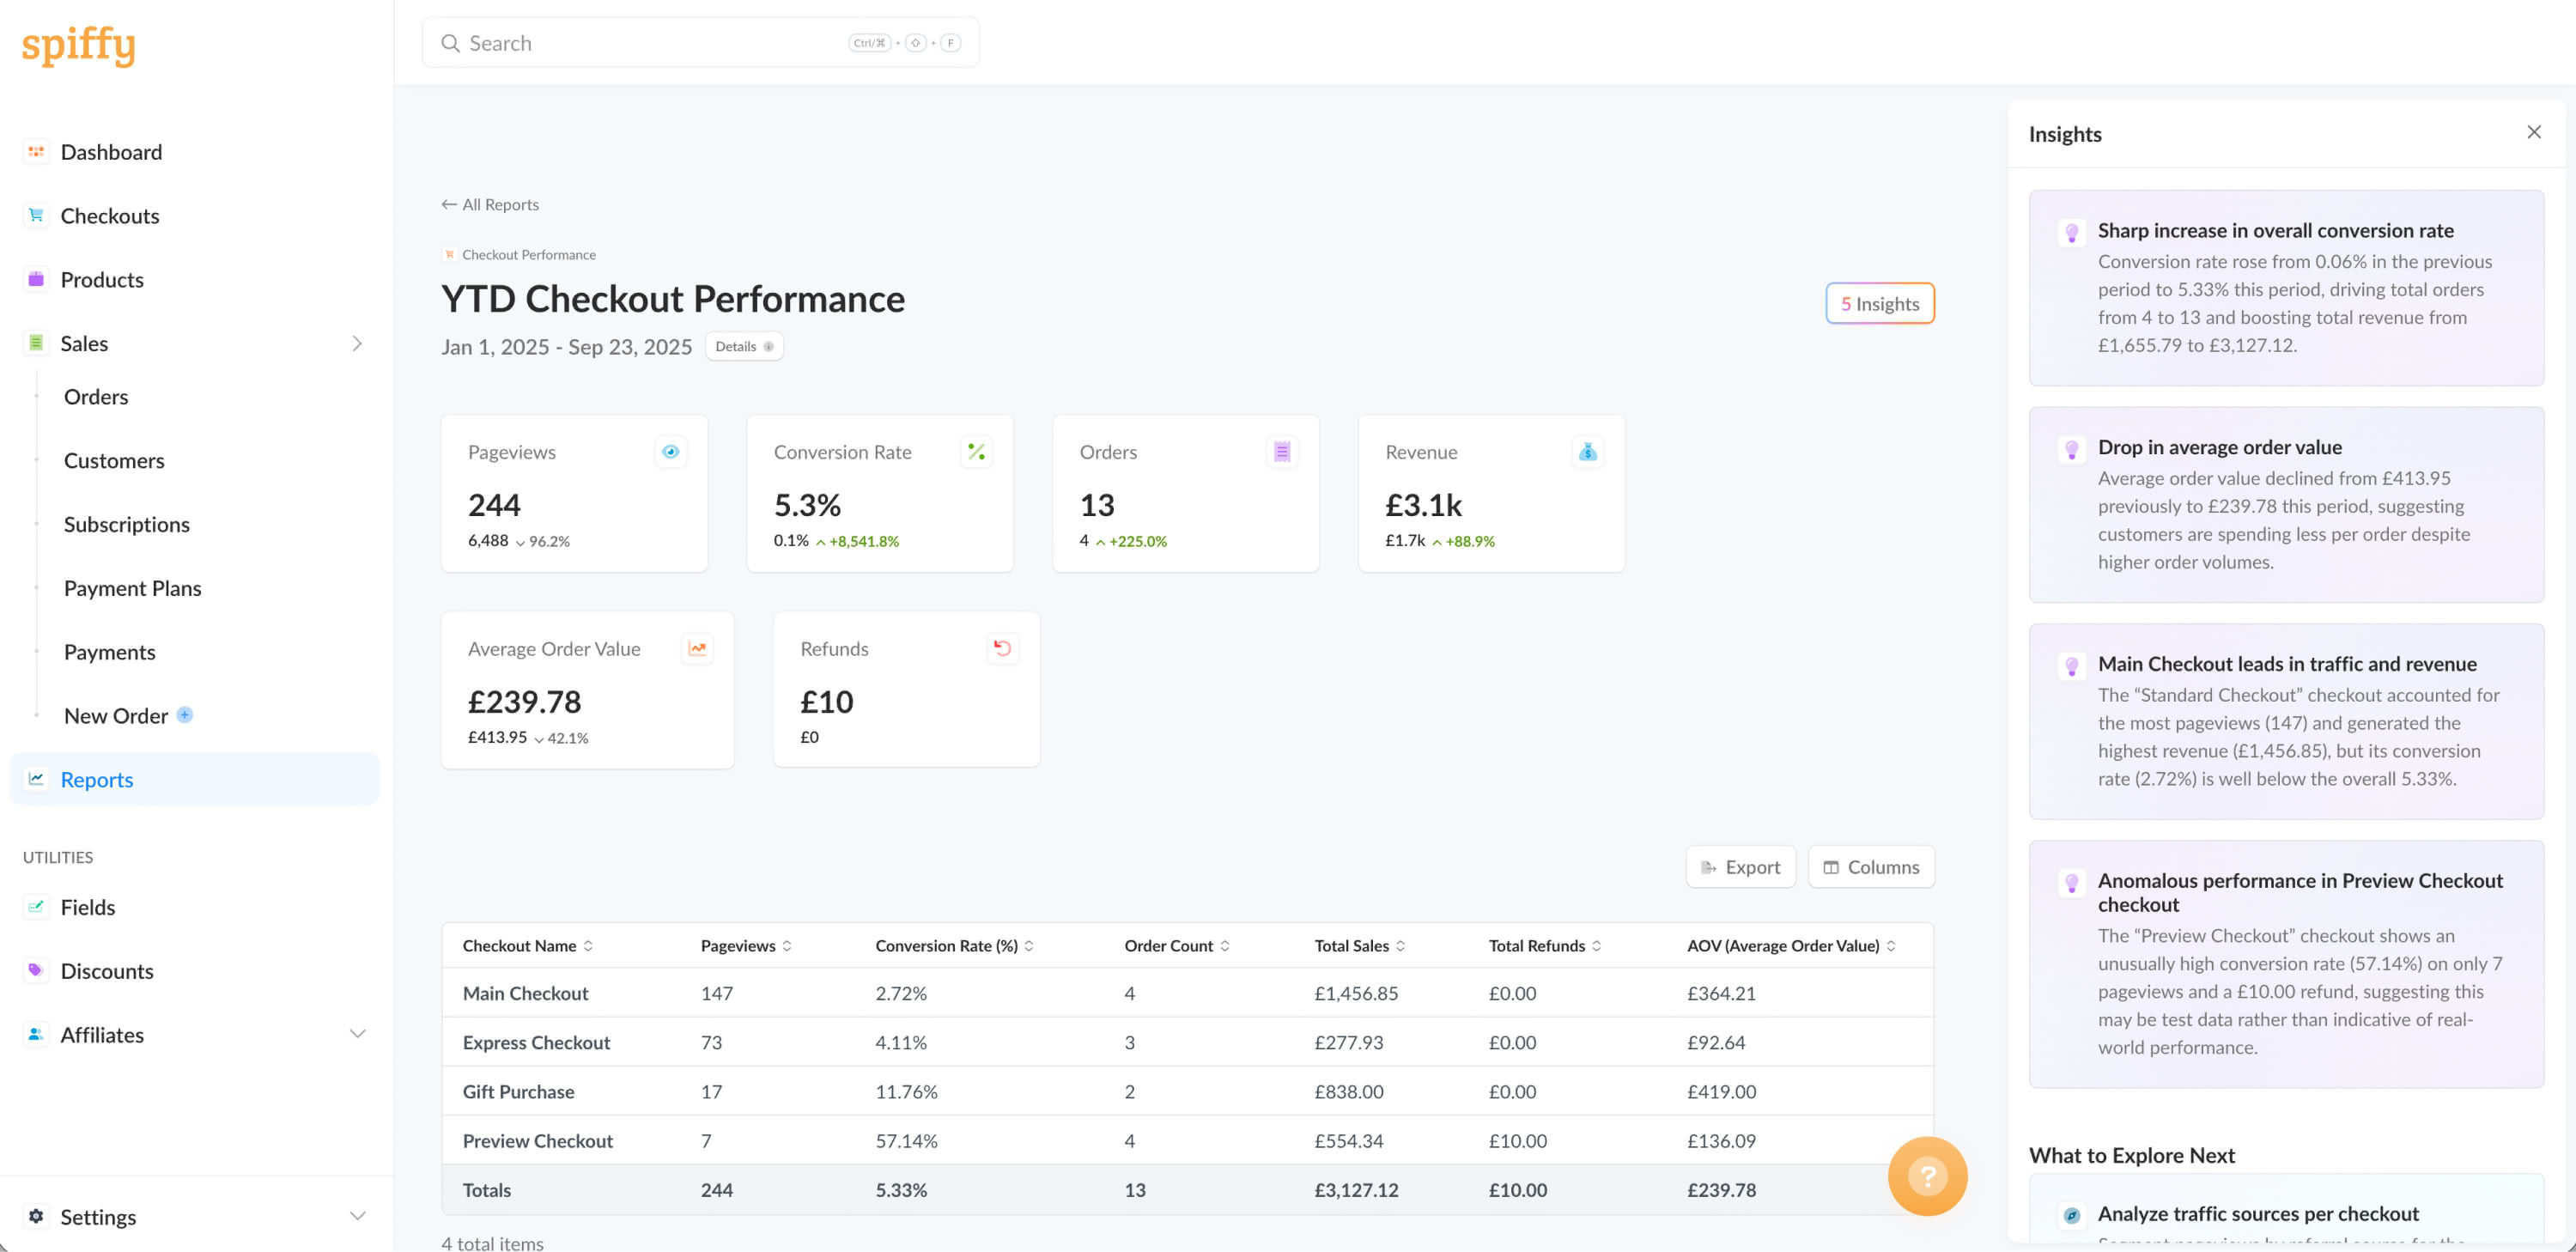
Checkout performance
Find abandoned checkouts, failed payments, conversion issues, and gateway gaps.
Data export
Export reports to CSV for finance work, deeper analysis, and BI workflows.
AI insights
Spot changes, summarize patterns, and decide what deserves attention.
Product analytics
Find your best-selling products without guessing.
Product reports show revenue by product, sales volume, and performance comparison so you can see which offers deserve more focus.
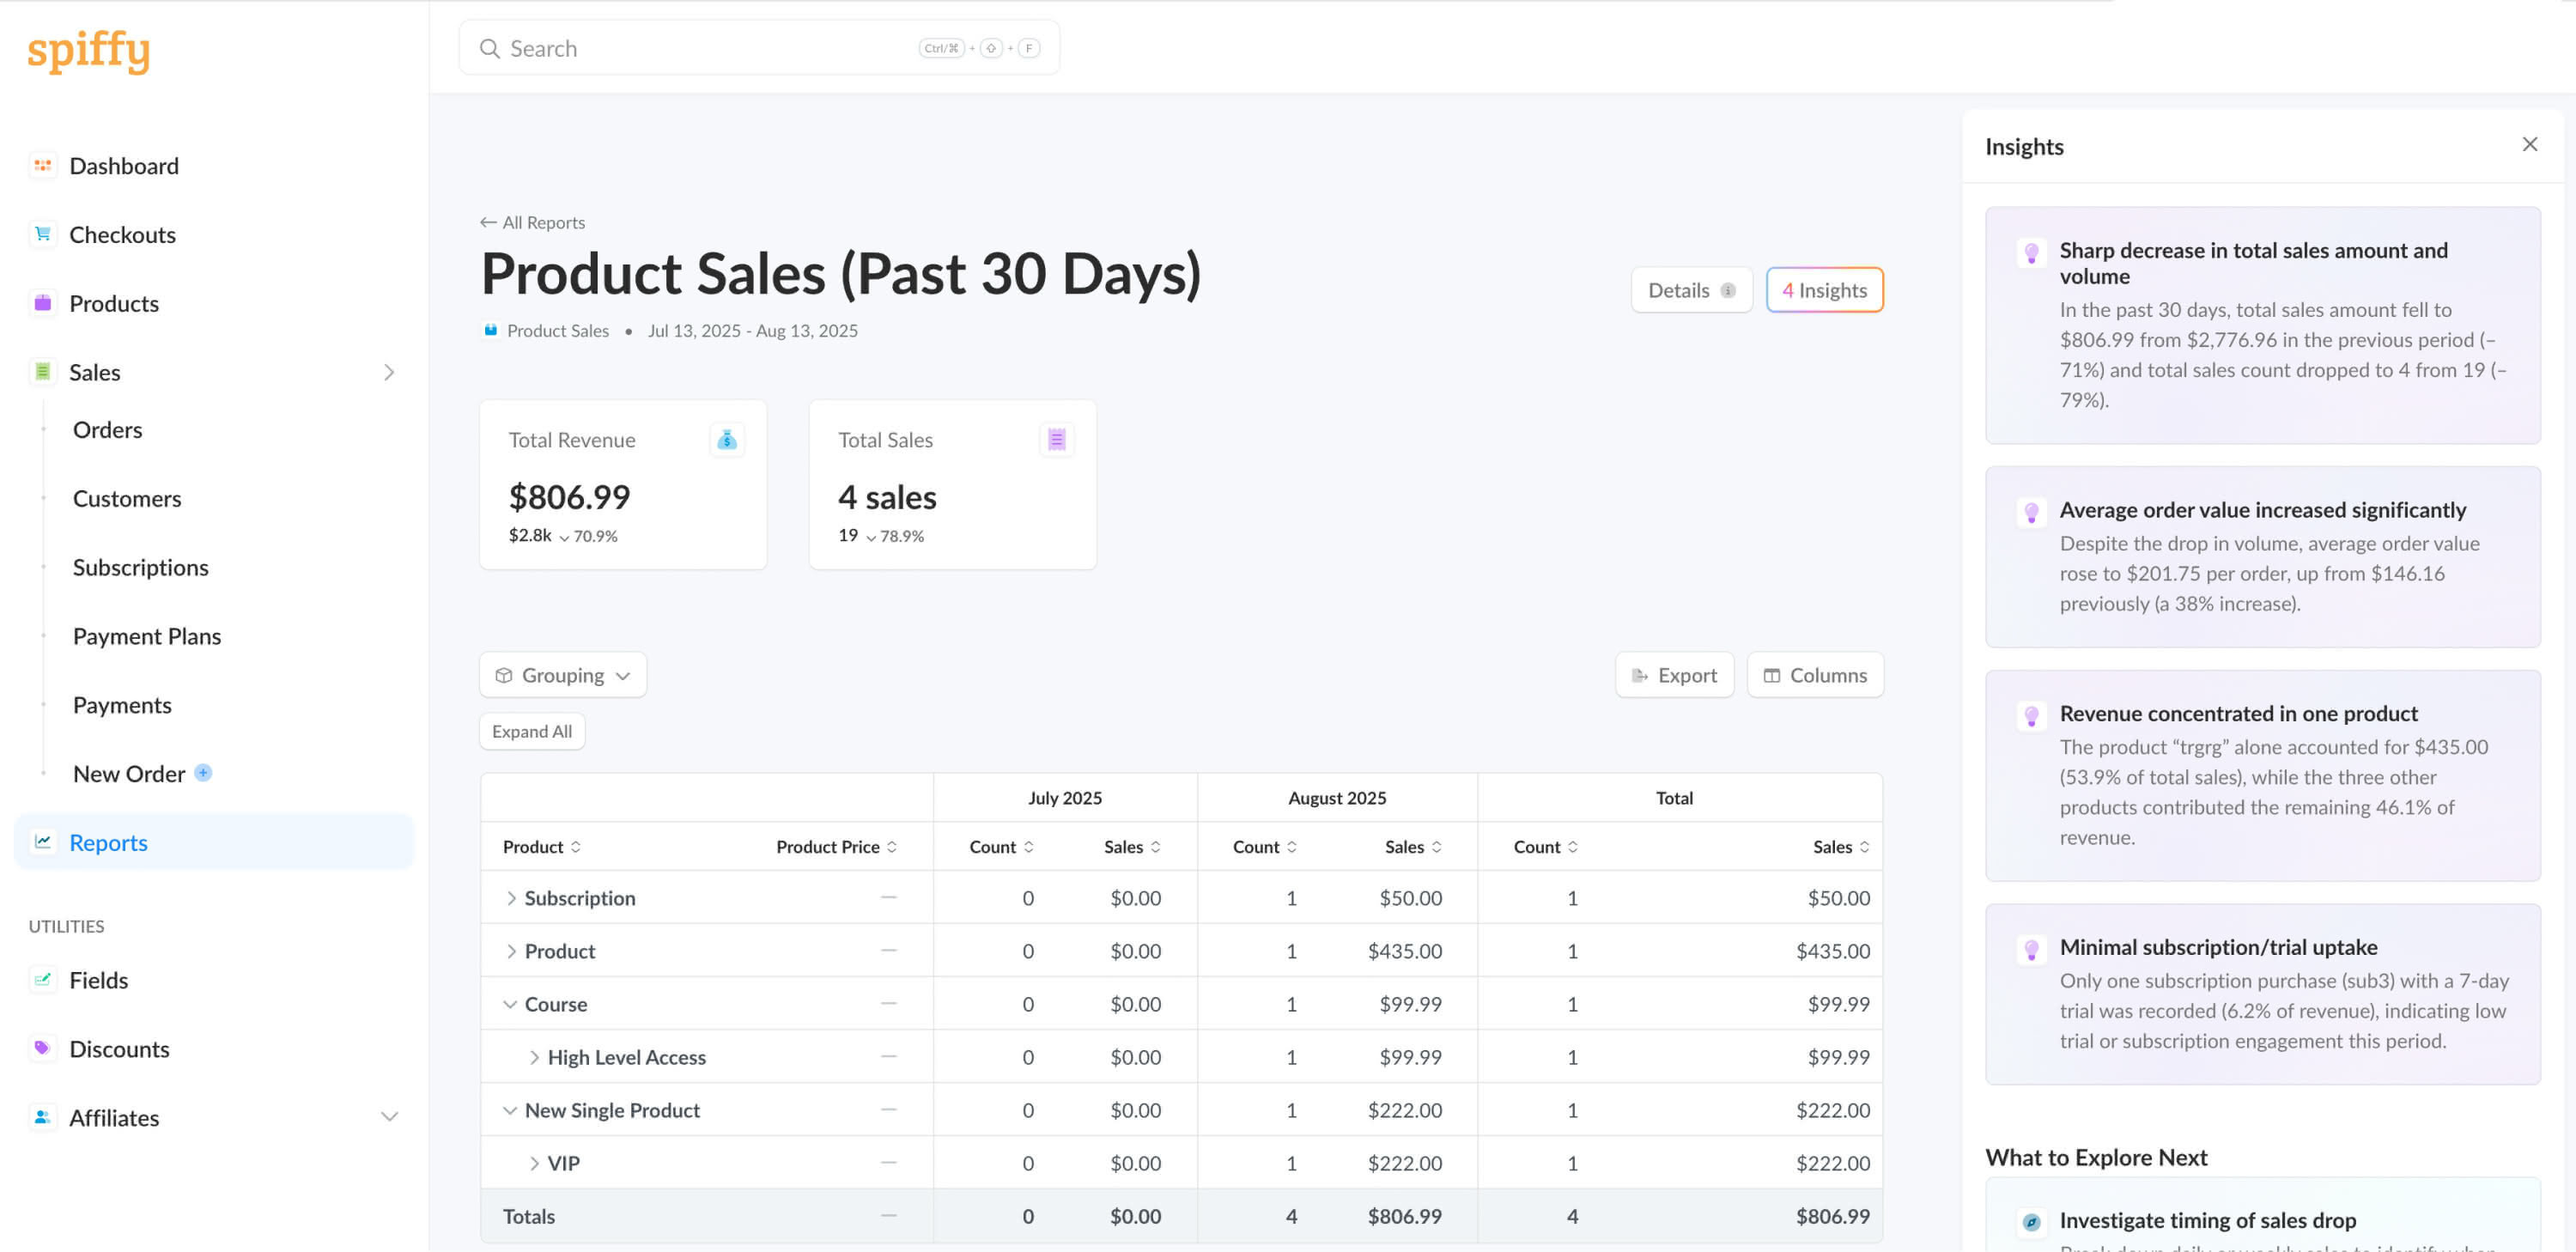
Product sales report
See exactly which products bring in the most revenue and which offers deserve more focus.
- Revenue by product
- Sales volume tracking
- Product comparison
Product performance stats
Track what is selling best, what needs attention, and how individual product dashboards are trending.
- Dashboard statistics
- Performance tracking
- Product-level insights
Product-level and checkout-level views
Separate strong offers from strong checkout placement, then export the data when the team needs deeper analysis.
Checkout analytics
Stop losing sales at the payment step.
Checkout reports make abandonment, failed payments, gateway performance, and conversion tracking visible enough to fix.
Checkout performance report
Identify where customers abandon checkout and what needs to be improved to convert more visitors into buyers.
- Completion rates
- Take-rate analytics
- Conversion tracking
Failed payments report
Find out why payments fail, where recovery is working, and when to pair the report with billing automation.
- Failed payment tracking
- Recovery rates
- Gateway performance
Checkout bottlenecks
Report on checkout flow, processor behavior, and payment outcomes together instead of treating each issue as a separate guess.
Customer analytics
Keep your best customers longer.
Understand lifetime value, revenue per customer, churn indicators, subscriber performance, referrals, and affiliate attribution.
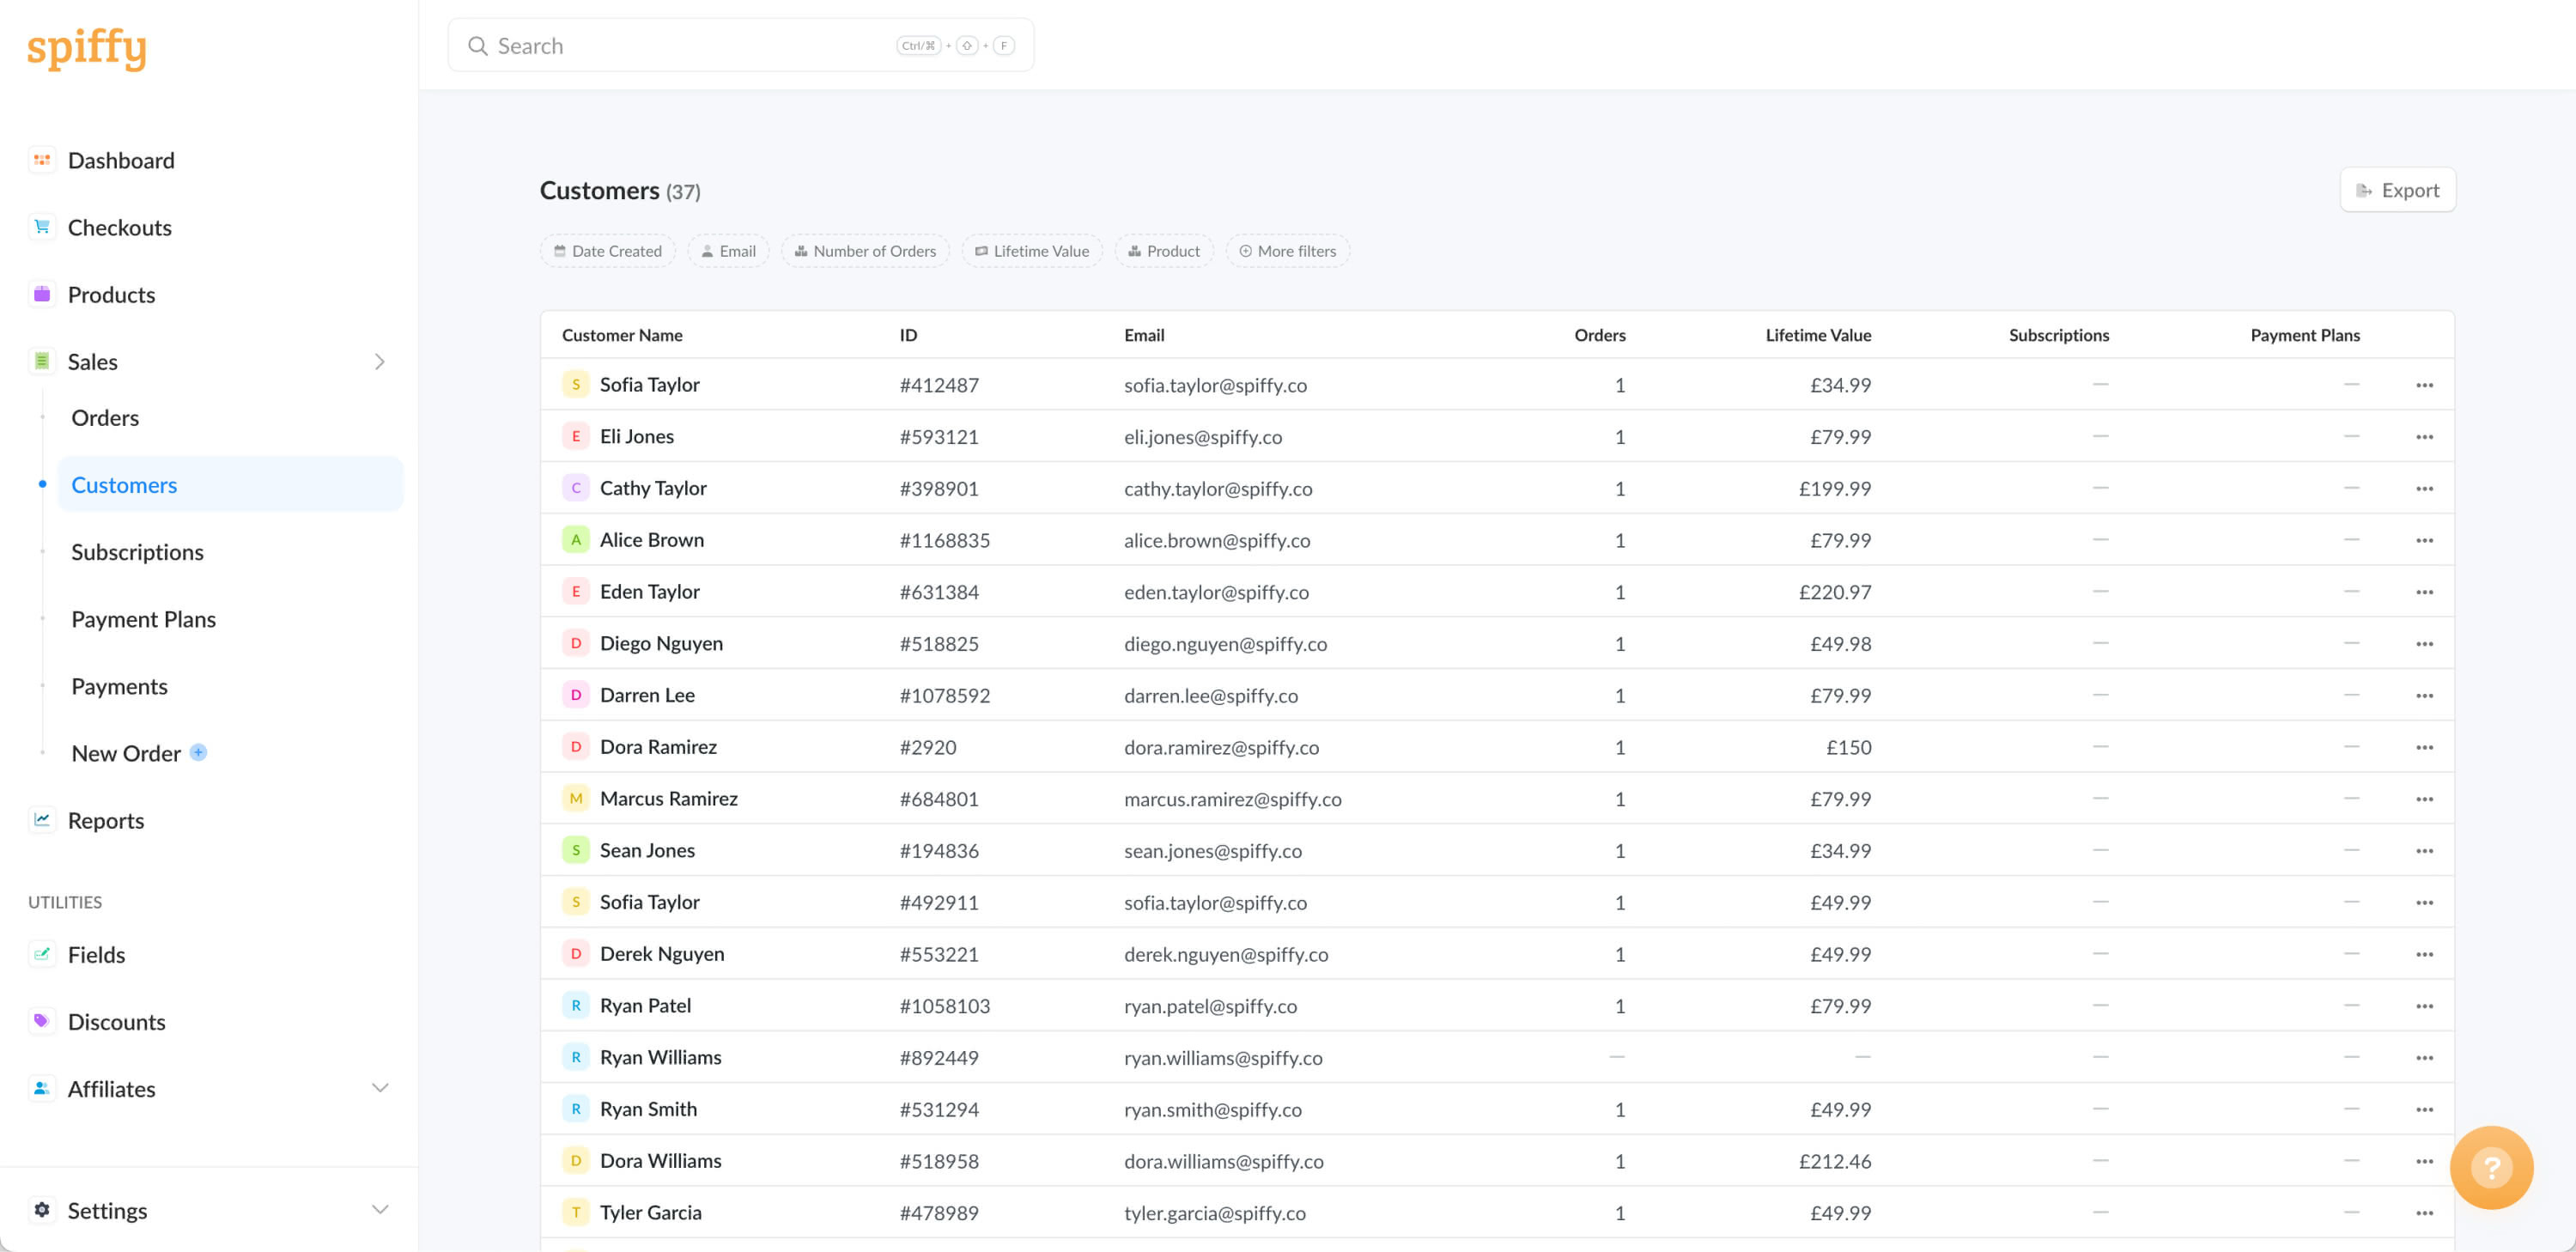
Lifetime value report
Find your most valuable customers and understand who is worth investing in for retention.
- Customer lifetime value
- Revenue per customer
- Customer value insights
Customer performance metrics
See which subscribers are likely to cancel and which recurring revenue metrics need attention.
- Subscriber analytics
- Churn-rate tracking
- MRR and revenue metrics
Affiliate analytics
Track which affiliates and referral sources bring in valuable customers, and keep commission reporting connected to actual performance.
- Affiliate performance
- Referral source analytics
- Commission reporting
Advanced analytics
Slice the business from more than one angle.
Use report filtering to connect campaigns, customers, products, payments, dates, and financial events to real revenue outcomes, then send the context into the integrations your team already uses.
Marketing analytics
UTM campaigns, traffic sources, promo codes, campaign performance, and affiliate attribution. Start with consistent links using our free UTM builder.
Customer segmentation
Purchase history, lifetime value, login activity, customer engagement, and payment behavior.
Product strategy
Product status, pricing options, product ownership, creation dates, and affiliate program tracking.
Revenue optimization
Payment status, currency, total amounts, payment methods, promo codes, and affiliate data.
Custom date ranges
Payment dates, subscription events, trends over time, seasonal patterns, and customer activity.
Financial analytics
Card expiration, refunds, chargebacks, gateway performance, and 3D Secure transactions.
Spiffy is by far the most impressive service we use across every aspect I can think of.
We looked at about ten potential solutions. None of them came close to what Spiffy could do for us. Managing our e-commerce was a nightmare previously, and now it is just plain easy.
Analytics questions?
Need help deciding which reports matter for your setup? Get in touch.
What analytics can I see in Spiffy?
Can I compare product and checkout performance?
Can reports help with failed payments?
Can I filter reports by campaign or customer data?
Ask about Spiffy on
Know what is working before you change what you sell.
Use Spiffy analytics to understand product revenue, checkout performance, customer value, and payment behavior from one connected selling system.